
#
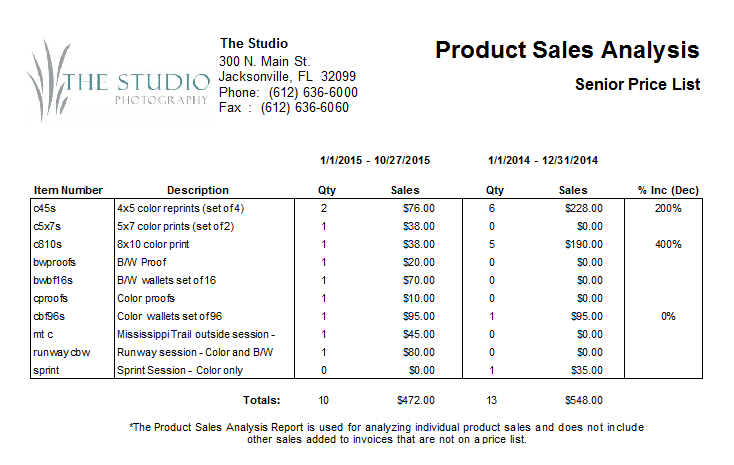
The Product Sales Analysis is a great way to analyze your individual product sales. This report shows sales of products in a specific price list, category, group, and product line. You can compare product sales between two periods or between two predefined filters.
Running a Sales Analysis Report #
Follow these steps to generate a Sales Analysis report:
-
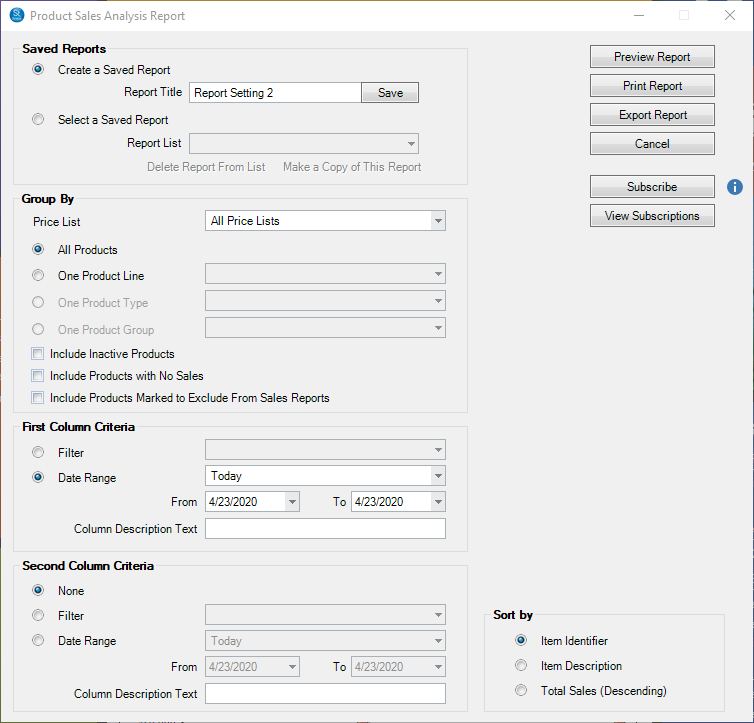
In Stratus Desktop, go to Reports > Analysis Reports > Product Sales Analysis Report.
-
Choose a specific price list or select All Price Lists.
- Select a Product Line, if desired.
-
Select a Product Category and/or Product Group if desired.
-
You can select any of the following options:
-
Include Inactive Products
-
Include Products with No Sales
-
Include Products Excluded from Sales Reports – See also: Price List
-
-
Select a From criteria and input a date range, or choose a Filter from the drop-down menu. See also: Filters
-
Enter description for the first column.
-
If you want to compare two columns, select a Second Column Criteria and enter a description.
-
Organize your report by choosing a Sort By option:
-
Item Identifier
-
Item Description
-
Total Sales
-
Click Preview Report to preview the report before you print it.
-
Print the report or Export it as a PDF or Excel spreadsheet. Use the Subscribe button to receive automated email delivery of this report on scheduled days or date. See also Saved Reports and Subscriptions
-
Close the window when finished.