
  |
NOTE: This feature is available in the Professional and Enterprise versions of Stratus Desktop. |
The Dashboard includes a powerful feature that allows you to “drill down” and view the data behind each of your performance gauges and reporting charts. Whenever you see a gauge or chart, simply double-click on it. A grid window will open, showing you the appropriate data that is used to build that gauge or chart.
When drilling down on a chart, you can double-click in two different areas. Double-clicking on a chart element –
like a column, bar, or piece of the pie –
will open a grid window that displays just the data behind that single element. Double-clicking on any other portion of the chart – like the blank white space – will open the entire report window that belongs to this panel, allowing you to view all the data behind the chart. Whenever you see a data grid or table displaying data from a set of records, try double-clicking on an individual row to open up an individual record.
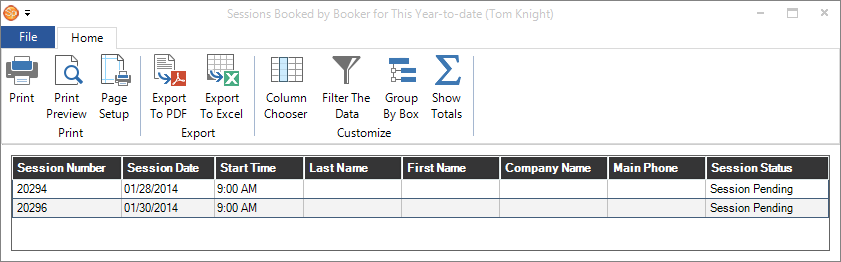
Drilling down on your data is the best way for you to understand the meaning behind your numbers. For example, if you notice that one sales person has a lower average sale than another sales person, try drilling down into the data to better understand why. Maybe one salesperson is doing a better job selling packages or up-selling large prints. Use this information as a training tool. Also, let’s say there are a couple weeks that have a much higher count of new leads. Why? Did you run an email campaign the week before? Did those new leads convert to new bookings? Double-clicking on the chart to drill down into the data will allow you to answer these and many other important questions.
Customization Options
#
The Dashboard data grids include some great customization tools to help you analyze your data. Use the tools in the Customize group of the ribbon or right-click on any column header and choose from the following features on the displayed menu:
-
Sort – Clicking Sort Ascending or Sort Descending is the same as single-clicking on a column header. Use either method to sort your data by the desired column.
-
Summary – Add summary capabilities to any column on the report. Summary features include: totaling a column, averaging a column, finding the maximum or minimum value in a column, or calculating the total count of a column. The summary information is displayed in the report footer as well as in the footer section of each group.
-
Group By – The report data grids also have grouping capabilities. For example, to group all invoice records by the Invoice Type field, simply right-click on the Invoice Type column and select Group By This Field. Another option is to click Group By Box on the ribbon (or right-click and select it from the menu). The Group By Box will be displayed above the data grid. Simply drag-and-drop one or more columns to this box and your data will be divided into separate groups.
-
Filter – Use the filtering feature to narrow down a large set of data to a smaller set that you really care about. To start filtering your data, click Filter the Data on the ribbon (or right-click and select it from the menu). You will notice a new funnel symbol appear in the header of each column. Click one of those symbols to see the options that can be used to narrow down your data. If you don’t see what you’re looking for, try selecting the Custom option from the list. You can then build your own custom filters for each column. When you’re done filtering your data and are ready to return to the original full data set, simply right-click the column and select Clear All Filters from the menu.
-
Column Chooser – To change which columns are displayed in the grid, click Column Chooser onthe ribbon (or right-click and select it from the menu). In the Column Chooser, select the columns you’d like displayed in your grid layout. After closing the Column Chooser, drag-and-drop your column headers to rearrange the data. Columns can also be resized by either dragging and dropping the splitter bar between two columns or selecting Best Fit from the pop-up menu.
-
Save Data Grid Customization -Any customization you make to the data grid is automatically saved with the report. The next time the report is opened, the data grid will be displayed with the last customization options you chose.