
  |
NOTE: This feature is available in the Professional and Enterprise versions of Stratus Desktop. |
A Dashboard Report provides you with an almost infinite number of reporting possibilities, giving you visual feedback about the performance of your business. Report panels are highly customizable, allowing you to choose from multiple performance indicators, multiple ways to group your data, multiple date ranges, and multiple ways to visualize your data with different chart types. These reports can be saved and recalled later from the main Reports menu in the software or viewed directly from the Dashboard.
Creating a Dashboard Report #
Follow these steps to create a report panel:
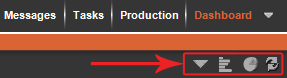
- Click Create New Report on the Dashboard toolbar.
 #
# -
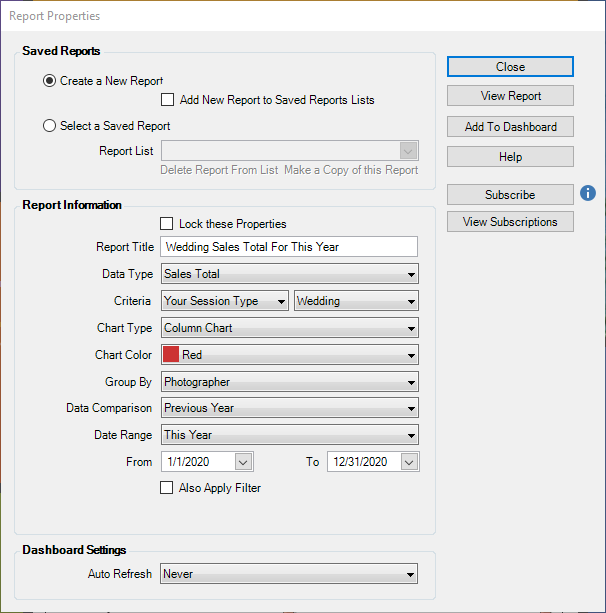
Select the appropriate option to Create a New Report or open a Saved Report. Each report you create can either be “run” once or saved to a reports list to be used again in the future. All saved Dashboard reports will also be displayed on the main Reports > Dashboard Reports menu in the software. Note: Any reports you want displayed on a Dashboard must also be saved to the Saved Reports list.
-
Check Lock these Properties to protect this report from changes. Only those users with the appropriate security clearance will be allowed to lock/unlock the report to modify it.
-
Also take a look at the bottom right corner of the window. A blue notice will be displayed if the report you’re modifying is currently in use, either on the company Dashboard or any individual user Dashboards. This message lets you know ahead of time if the report you’re modifying or deleting is currently being used.
-
A default Report Title is provided for you. The software will automatically update the default title if any of the report options are modified (e.g., changing the date range from month-to-date to year-to-date will automatically be reflected in the title of the report). You can choose to override the default title and replace it with your own custom title. Note: If you choose to replace the default report title with your own title, it will not be automatically updated if the report criteria is changed in the future – you will be responsible to maintain it. To reset the report title back to the default, simply delete the existing title and the software will take over maintaining the report title.
-
Choose a Data Type (also called Key Performance Indicator) you want to track.
Data Type Based On
Description Appointment Turnaround Days
Session Date
Average number of days between a session within a selected date range and/or filter and the first linked appointment after the session. This shows how long it takes to get clients back in for their sales presentation. Appointments – Actual Appointment Date
All linked appointments for a selected date range and/or filter. Excludes: Cancelled and NoShow appointments. Appointments – All
Appointment Date
All linked appointments for a selected date range and/or filter. Includes: Cancelled and No Show appointments. Appointments – Booked Appointment Booked Date
All new linked appointments booked for a selected date range and/or filter. Excludes: Cancelled and No Show appointments. Average Sales by Initial Order
Invoice Date
Average of all initial orders received in a selected date range and/or filter, less any discounts and loyalty rewards, and less any items in the price list that have been checked to “Exclude From Sales Reports.” This data is very useful in determining the effectiveness of your sales process and your ability to close large, up-front orders. Average Sales by Session
Session Date Average income for a group of sessions within a selected date range and/or filter. Only sessions that have been completed (the session is at the “Final” status as defined in your session statuses) are included. Excludes: No Show, Cancelled, and Redo sessions. (This eliminates sessions that are still open or still waiting for orders, which would skew your averages.) There are some additional settings that will affect this report. On the Company (Studio) Preferences > Reports tab, you can choose the specific types of invoices that should be included in your sales averages. Also, any items that have been checked in the price list to “Exclude From Sales Reports” are removed before calculating the averages. See also: Company (Studio) Preferences – Reports, Price List Reference and Session Statuses Clients Net Promoter Score Delta
Net Promoter Score
This report will show you the average NPS delta of the selected set of clients. A Delta is the difference between a client’s most recent session’s NPS and their previous one. Showing you how your Net Promoter ratings have changed over time! See also: Net Promoter Scores (NPS) Conversions – Bookings to Actual Sessions
Session Booked Date
Percentage of sessions booked during a selected date range and/or filter that actually resulted in a session. Excludes: No Show, On Hold, and Cancelled sessions. Conversions – Leads to Actual Sessions Client Create Date
Percentage of new leads acquired during a selected date range and/or filter that actually completed a session. Excludes: No Show, On Hold, and Cancelled sessions. Conversions – Leads to Bookings Client Create Date Percentage of new leads acquired within a selected date range and/or filter that booked a session. Conversions – Leads to New Clients Client Create Date Percentage of new leads acquired within a selected date range and/or filter that actually became clients. Emails – All Communication Sent/Received Date All emails within a selected date range, filter, and/or special Criteria. Emails Bounced (Stratus Only) SendGrid – Delivery Status All emails that have bounced within a selected date, filter, and/or special Criteria. Note: This report requires the StudioPlus Mail Service. See also: StudioPlus Mail Overview Emails Clicked (Stratus Only) SendGrid – Delivery Status All emails that have had one or more hyperlinks clicked within an email from a selected date range, filter, and/or special Criteria. Note: This report requires the StudioPlus Mail Service. See also: StudioPlus Mail Overview Emails Delivered (Stratus Only) SendGrid – Delivery Status All emails that have been successfully delivered to the recipient within a selected date range, filter, and/or special Criteria. Note: This report requires the StudioPlus Mail Service. See also: StudioPlus Mail Overview Emails Opened (Stratus Only) SendGrid – Delivery Status All emails that have been received and opened by the recipient within a selected date range, filter, and/or special Criteria. Note: This report requires the StudioPlus Mail Service. See also: StudioPlus Mail Overview Emails Received Communication Received Date All incoming emails within a selected date range, filter and/or special Criteria. Emails Sent Communication Sent Date All outgoing emails within a selected date range, filter, and/or special Criteria. Emails Spam Reported (Stratus Only) SendGrid All emails that recipients have reported as Spam within a selected date range, filter, and/or special Criteria. Note: This report requires the StudioPlus Mail Service. See also: StudioPlus Mail Overview Emails Unsubscribed (Stratus Only) SendGrid All emails for recipients who clicked to unsubscribe within a selected date range, filter, and/or special Criteria. Note: This report requires the StudioPlus Mail Service. See also: StudioPlus Mail Overview Estimates Estimate Date All estimates with an “Estimate Date” within a selected date range and/or filter. Hours Worked Per Initial Order Time Clock and
Invoice DatesTotal number of hours worked (based on time clock entries) divided by the number of initial order invoices. See also: Time Clock Invoices – Paid in Full Percentage Invoice Date Percentage of invoices for a selected date range and/or filter that were paid in full on the same day the order was taken. Invoices with no Purchase Order Invoice Date
Total number of Initial Order or Reorder invoices within a selected date range and/or filter for which no purchase order has been created. Labor Costs Time Clock and
Invoice DatesHourly wages (hours from the time clock multiplied by the employee’s hourly rate), plus salaried wages (annual salary divided by 365 multiplied by the number of days in the report range), plus commissions (standard commissions calculated by the software for bookers, photographers, assistants, and sales reps.) See also: Time Clock Loyalty Rewards Issued
Issued Date Total amount of loyalty rewards, both outstanding and redeemed, within a selected date range, criteria, and/or filter. Loyalty Rewards Redeemed
Redeemed Date
Total amount of loyalty rewards redeemed within a selected date range, criteria, and/or filter. New Client Referrals
Referred By
Total number of clients referred within a selected date range, criteria, and/or filter. New Clients Client Since Date Total number of prospects that actually became clients within a selected date range and/or filter. Note: The date you create the client’s first invoice or session record becomes the “Client Since” date, which is the basis for this data. New Leads Client Create Date
Total number of new client leads recorded in the software during a selected date range and/or filter. This is based on the client “Create Date” field. New Leads is a great indicator of potential new business opportunities, as well as providing valuable information about the effectiveness of your various marketing plans. Payment Receipts Payment Date
All payments received within a selected date range and/or filter. Excludes: payment methods that have been flagged to Exclude from Reports. See also: Payment Methods Payments Pending
Payment Due Date
All payments checked as a Future Payment for a selected date range. Excludes: payment methods that have been flagged to Exclude from Reports. See also: Payment Methods Phone Calls – All Call Due Date All phone calls due within a selected date range and/or filter. Phone Calls – Completed Call Complete Date All phone calls completed within a selected date range and/or filter. Phone Calls – Open by Due Date Call Due Date All phone calls due within a selected date range and/or filter that do not have a “Complete Date.” Phone Calls – Past Due by Due Date Call Due Date All phone calls due within a selected date range and/or filter that do not have a “Complete Date” AND are past due as of today. Production Orders – All
Order Date
All production orders for a selected date range and/or filter. Exclusions: none. Production Orders – Completed Order Date
All production orders for a selected date range and/or filter that are completed (meaning the production order is set to the “Final” status as defined in your production statuses. See also: Production Statuses Production Orders – Open by Due Date Order Due Date
All production orders due within a selected date range and/or filter that are not at their final status. Production Orders – Past Due by Due Date Order Due Date
All production orders due within a selected date range and/or filter that are not at their final status AND are past due as of today. Production Orders – Reorders
Order Date
Total cost of all production orders within a selected date range and/or filter that required a reorder. Sales Per Hours Worked Invoice Date and
Time ClockSales – Total (as described below) divided by the total number of hours worked according to the time clock entries for this date range. See also: Time Clock Sales – In-House
Invoice Date
The same as Sales – Total but excluding invoices downloaded from InSpiredByYou.com. Sales – Total
Invoice Date
All sales made within a selected date range and/or filter, less any discounts. Excludes: price list items that have been checked to “Exclude From Sales Reports.” See also: Price List Reference Sales – Web Invoice Date
The same as Sales – Total but limited to just those invoices downloaded from InSpiredByYou.com. Sessions – Actual Session Date
Total number ofsessions occurring within a selected date range and/or filter. Excludes: Cancelled and No Show sessions. Sessions – All
Session Date
Total number of sessions occurring within your selected date range (or today). Includes: Cancelled, On Hold, No Show, and Redo sessions. Sessions – Booked Session Booked Date
Total number of new sessions booked within a selected date range and/or filter. This provides a great “leading indicator” of how your business will be in the future. Excludes: Redo sessions Sessions – Cancelled Session Date
All sessions scheduled to occur within a selected date range and/or filter that were cancelled. Sessions – No Show
Session Date
All sessions scheduled to occur within a selected date range and/or filter that resulted in a No Show. Sessions – Placed on Hold
Session Date
All sessions scheduled to occur within a selected date range and/or filter that were placed On Hold. Sessions – Rescheduled
Session Date
All sessions scheduled to occur within a selected date range and/or filter that were rescheduled. Sessions – Zero Dollar Invoice
Session Date
All sessions within a selected date range and/or filter that have an “initial order” invoice for $0. Sessions – No Initial Order Session Date
All sessions within a selected date range and/or filter that do not have an “initial order” invoice. Sessions – Needing an Appointment Session Date All sessions within a selected date range and/or filter that do not have an upcoming appointment scheduled and also do not have an “initial order” or “reorder” invoice. Excludes: Cancelled and No Show appointments, as well as Cancelled, On Hold, and No Show sessions. Sessions – Net Promoter Ratings NPS Received Date This report will show you the average NPS rating given on the selected set of sessions. Note: This report will display information based on the NPS Received Date not the Session Date. Sessions – Net Promoter Score NPS Received Date This report will show you your business’s Net Promoter Score based on the selected set of sessions. This data is found by taking the total percentage of Promoters (9-10) and subtracting the total percentage of Detractors (0-6). Note: This report will display information based on the NPS Received Date not the Session Date. Tasks – All Task Due Date
All tasks due within a selected date range and/or filter. Tasks – Completed
Task Complete Date
All tasks completed within a selected date range and/or filter. Tasks – Created
Task Create Date
All tasks created within a selected date range and/or filter. Tasks – Open by Due Date
Task Due Date
All tasks due within a selected date range and/or filter that do not have a “Complete Date.” Tasks – Past Due by Due Date
Task Due Date
All tasks due within a selected date range and/or filter that do not have a “Complete Date” AND are past due as of today. -
Choose the Criteria to add extra specifications to the report without needing a filter. Note: The Criteria options available on the drop-down list will vary based on the Data Type selected for the report.
-
Choose the Chart Type.
-
Personalize the chart by choosing the Chart Color.
-
Use the Group By feature to break down your information into even smaller, more defined sets of data. Note: The Group By options available on the drop-down list will vary based on the Data Type selected for the report.
-
Choose a Data Comparison option if available. Every report will print the “Actual” data for the date range and criteria you have selected. You may also have the option to compare the actual data against data from the previous year or your budget numbers. Note: If your report is based on a filter (see step 12 below), you will not be given a data comparison option.
-
Select the Date Range. By choosing a named date range, like “This Year-To-Date,” the software will automatically determine the start and end dates for you. You may choose to enter your own From and To dates.
-
Apply a Filter to the report. This can be done in addition to choosing a date range or instead of choosing a date range. Note: If you are applying a filter and a date range, do NOT include any date criterion in the filter. This could cause a potential conflict with the date ranges being applied by the report.
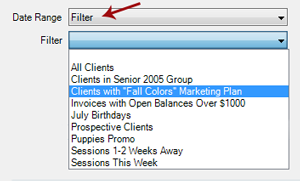
To select a filter instead of selecting a date range, simply select Filter from the Date Range combo box and then choose a filter from the Filter combo box as shown in this screenshot.
-
Finally, set how often you want the report to automatically refresh when it is open on a Dashboard.
-
Click View Report to open a Dashboard report window displaying the chart and data. This report window provides the tools you need to print, export, modify, and customize your report. See the Running a Dashboard Report section below for more details.
-
Click Add to Dashboard to display this report panel on your Dashboard. Or use the Subscribe button to receive automated email delivery of this report on scheduled days or date. See also Saved Reports and Subscriptions
Modifying a Dashboard Report #
Use one of the following methods to modify an existing report:
From a Report Panel #
-
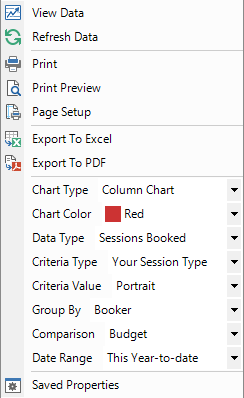
Click the down arrow in the upper-right corner of the panel to open the Report Options menu.
-
To temporarily change the report, simply make changes to the list of options shown on the menu. Note: Any changes you make this way will NOT be saved.
-
To make permanent changes to the report, click Saved Properties to open the properties window and make the necessary changes there.
From a Report Window #
-
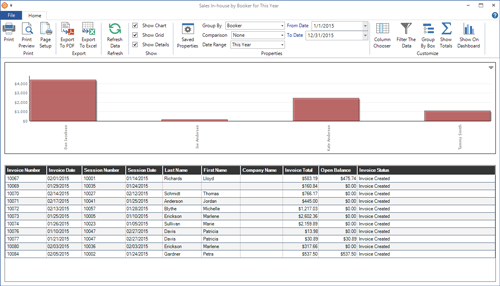
Open the report window.
-
To temporarily change the report, simply make changes on the ribbon. Note: Any changes you make this way will NOT be saved.
-
To make permanent changes to the report, click Saved Properties to open the properties window and make the necessary changes there.
From the Dashboard Menu #
-
Click Create New Report on the Dashboard toolbar.
-
Select the Saved Report from the drop-down list.
-
Modify the report.
From the Software’s Reports Menu #
-
Go to Reports > Dashboard Reports and click Add/Modify Report.
-
Select the Saved Report from the drop-down list.
-
Modify the report.
Running a Dashboard Report #
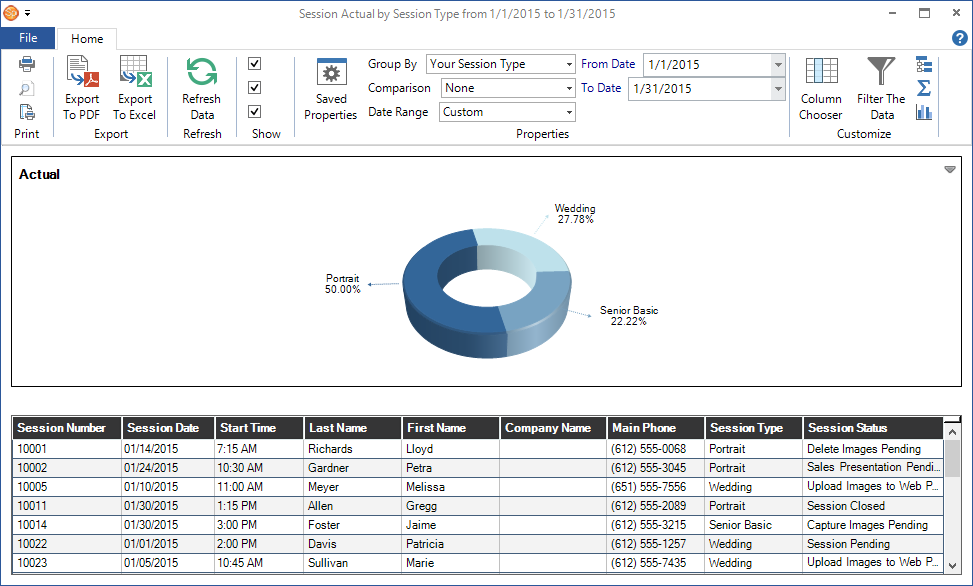
To open the reports window, either double-click on one of your visible Dashboard report panels or go to Reports > Dashboard Reports and select a report to open. There are several parts to the report window – a ribbon toolbar across the top, a graphical display of the report, and a data grid. The ribbon contains the tools you’ll use to work with and run your report.
Printing Options #
To print a hard-copy of your report, click Page Setup to define your print properties and then click Print. Use the Print Preview button to preview exactly how the report will look before you actually print it.
Export Options #
The Export group of the ribbon contains tools for exporting your data – either to an Adobe PDF document or to a Microsoft Excel spreadsheet. Note: When exporting to Excel, the first worksheet in your Excel workbook will contain the chart and the second worksheet will contain the data.
Viewing Options #
-
Click the Show Chart checkbox to toggle the chart section of the report window on or off.
-
Click the Show Grid checkbox to toggle the data grid section of the report window on or off.
-
Click the Show Details checkbox to toggle the data grid section between two different views. No Details will simply provide you with the summary numbers that are represented by each element in your chart, while the Detail View will list every record in the database that meets your reporting criteria and is used to build your report.
Property Options #
The Properties group of the ribbon allows you to make on-the-fly changes to a report. Changes made on the ribbon are meant to be temporary changes and won’t be saved with the report. To permanently alter the report, click Saved Properties and make your changes.
See “Creating a Dashboard Report” (above) for more details on changing the report properties.
Customization Options #
The Dashboard data grids include some great customization tools to help you analyze your data. Use the tools in the Customize group of the ribbon or right-click on any column header and choose from the following features on the displayed menu:
-
Sorting – Clicking Sort Ascending or Sort Descending is the same as single-clicking on a column header. Use either method to sort your data by the desired column.
-
Summary – Add summary capabilities to any column on the report. Summary features include: totaling a column, averaging a column, finding the maximum or minimum value in a column, or calculating the total count of a column. The summary information is displayed in the report footer as well as in the footer section of each group.
-
Group By – The report data grids also have grouping capabilities. For example, to group all invoice records by the Invoice Type field, simply right-click on the Invoice Type column and select Group By This Field. Another option is to click Group By Box on the ribbon (or right-click and select it from the menu). The Group By Box will be displayed above the data grid. Simply drag-and-drop one or more columns to this box and your data will be divided into separate groups.
-
Filtering – Use the filtering feature to narrow down a large set of data to a smaller set that you really care about. To start filtering your data, click Filter the Data on the ribbon (or right-click and select it from the menu). You will notice a new funnel symbol appear in the header of each column. Click one of those symbols to see the options that can be used to narrow down your data. If you don’t see what you’re looking for, try selecting the Custom option from the list. You can then build your own custom filters for each column. When you’re done filtering your data and are ready to return to the original full data set, simply right-click the column and select Clear All Filters from the menu.
-
Column Chooser – To change which columns are displayed in the grid, click Column Chooser onthe ribbon (or right-click and select it from the menu). In the Column Chooser, select the columns you’d like displayed in your grid layout. After closing the Column Chooser, drag-and-drop your column headers to rearrange the data. Columns can also be resized by either dragging and dropping the splitter bar between two columns or selecting Best Fit from the pop-up menu.
-
Show On Dashboard – Quickly add this report to your Dashboard as a report panel.
-
Saving Data Grid Customization -Any customization you make to the data grid is automatically saved with the report. The next time the report is opened, the data grid will be displayed with the last customization options you chose.