
 Q: How do I create reports for sessions booked? #
A: Here are several ways to find how many sessions have been booked (called and made sessions for) this week or month.
#
#
#
#
Instructions #
On the Home Page #
Did you know you can easily view your bookings by week, month, and year in the Today’s Snapshot panel on your home page? Although not printable, this information is always available and up-to-date.

Session Trends Report – Monthly #
The built-in Session Trends report (available in all versions of the software) allows you to see how many sessions are booked each month for each of your session types. See also: Session Trends
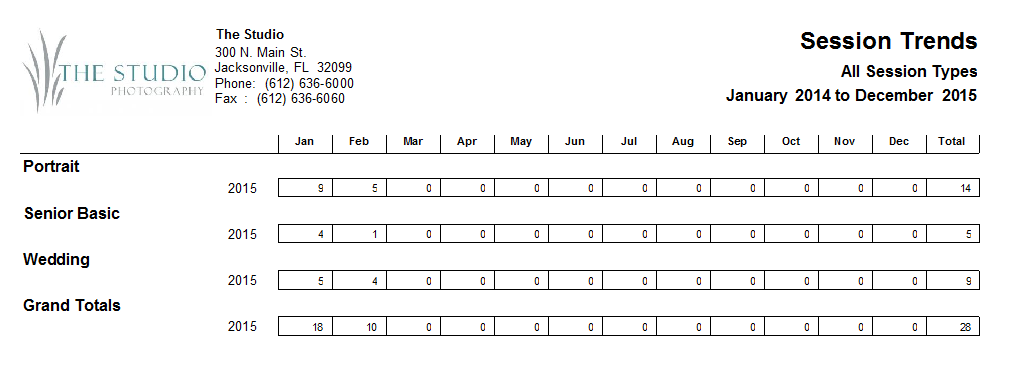
-
Go to Reports > Analysis Reports > Session Trends Report.
-
Select if you want to see the report based on Session Date or Date Booked.
-
Select the Date Range, the From and To month and year.
-
In the Report Starting Month select the start month.
-
Click Preview to see the report before you print it.
-
You can choose to Print the report or Export it to a PDF file.
Dashboard Reports – Weekly #
  |
NOTE: This feature is available in the Professional and Enterprise versions of both Spectra and Stratus Desktop. |
Since the Session Trends report described above is a monthly report, you’ll want to use the Dashboard (available in Spectra/Stratus Professional) to get a weekly report.
Think of the Dashboard report panel as a report with additional capabilities. The report panel is dynamic and flexible to give you the reporting information you need to run your business.
To create one of these dynamic reports, click the Add New Report button from either the main Reports > Dashboard Reports menu or from the Dashboard toolbar. Set the report properties and then click View Report. To print the report, click Page Setup to define your print properties, and then click Print. See also: Dashboard Reports
A Dashboard report panel has almost infinite reporting possibilities to give you visual feedback about the performance of your business. These report panels are highly customizable, giving you the ability to choose from multiple performance indicators, multiple ways to group your data, multiple date ranges, and multiple ways to visualize your data with different chart types. These reports can also be saved and recalled later from the Reports menu or viewed directly from the Dashboard.
Additional Information #
+ Training video – The Dashboard


